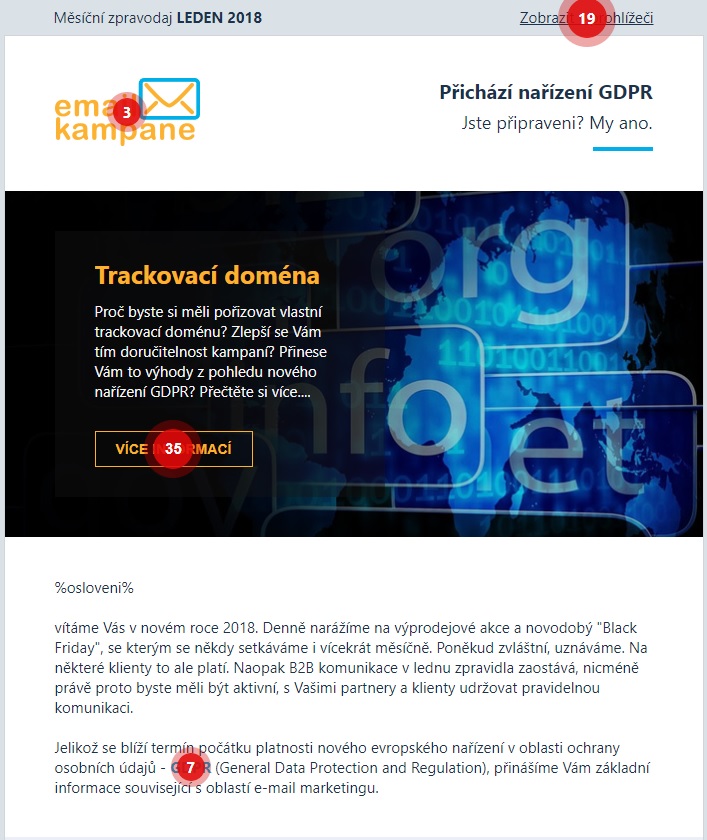
Click tracking, tracking of the most frequently clicked newsletter spots, results in nothing else but a heatmap. The heatmap visualizes the spots which attract the readers’ attention the most. This feature can now be found in the administration of our service under Statistics.
Using numerical bubbles depicted on the forefront of the sent newsletter, the heatmap shows you how many users have clicked through for each spot of the newsletter. These click numbers can be subsequently used as indicators for further changes and for achieving higher effectiveness in future campaigns. Moreover, when you click the bubble, you will see a complete list of recipients, who have done so.